
How to Read a Mining Pool Dashboard
When I first joined a mining pool, I remember staring at the dashboard like it was an alien control panel. Hashrate charts, worker statuses, payout graphs, and something called “shares” — it looked more like a flight simulator than a financial tool. It reminded me a lot of the learning curve I faced when expanding my setup — see Adding Four Avalon Qs: What Changed?
But once you learn how to read it, your mining pool dashboard becomes one of the most important tools you have. It’s your window into how your rigs are performing, how your rewards are tracking, and whether everything is working as efficiently as it should.
As Satoshi Squirrel likes to say:
“Even the smartest miner checks his gauges before digging.” 🐿️💻
So, let’s break it down together — in plain English (and maybe a few acorns).
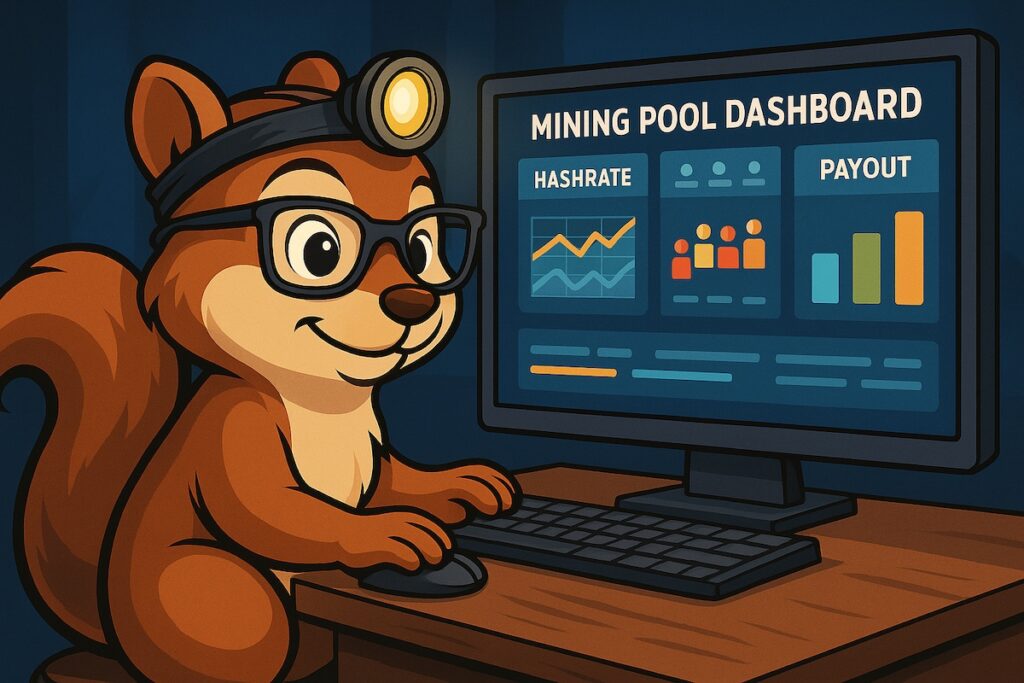
What Is a Mining Pool Dashboard?
When you join a mining pool, you’re teaming up with thousands of other miners around the world to share in rewards.
The dashboard is the place where all your activity and performance data come together. Think of it like a report card for your miners.
It shows things like:
- Your total hashrate
- How many miners (or “workers”) are active
- The pool’s collective progress on the next block
- Your share of the earnings
If your mining rigs are the workers in your forest, the dashboard is the tree trunk — the central place where all their efforts connect. 🌳
Key Sections of a Typical Pool Dashboard
Let’s go through the most common sections one by one.
1. Hashrate (and Why It Fluctuates)
Your hashrate is the total computing power you’re contributing to the pool.
You’ll usually see two types:
- Reported Hashrate: What your miners say they’re producing.
- Effective Hashrate: What the pool actually sees and confirms based on valid shares.
If your effective hashrate is consistently lower than reported, it could mean:
- Network lag or connection issues – This exact issue once caused some VoIP chaos in my own setup — I wrote about how I fixed it in How I Balanced Bitcoin Mining With VoIP
- Hardware instability or overheating
- Incorrect pool configuration
In short:
Reported = potential power
Effective = actual productivity
Satoshi Says: “You can’t just count acorns — you have to see which ones grow.” 🌰
2. Worker Status
Each mining device (like your Antminer S21+ or Avalon Q) is listed as a worker.
The dashboard will show whether it’s:
- ✅ Active — sending shares regularly
- ⚠️ Idle — connected but not working
- ❌ Offline — no activity detected
Keeping an eye on worker uptime is essential. Even one offline rig can drag down your efficiency and rewards.
Pro Tip: Set up email or app alerts from your pool so you’re notified if any worker goes dark.
3. Shares (and Why They Matter)
This is one of the most misunderstood metrics — but it’s simple once you get it.
A “share” is like a proof of effort. Every time your miner contributes valid work toward solving a block, it sends a share to the pool.
Think of it like squirrels gathering acorns for winter:
- Every acorn (share) counts toward the total stash (pool reward).
- The more acorns you contribute, the larger your share when the stash is divided.
Pools keep track of your shares to calculate how much Bitcoin you’ve earned.
4. Pool Luck and Block Progress
Some dashboards display “pool luck” — a measure of how fast the pool finds blocks compared to the statistical average.
- 100% luck means it took exactly as long as expected.
- Below 100% means the pool got lucky (blocks found faster).
- Above 100% means slower block discovery.
It’s all part of Bitcoin’s randomness — over time, it averages out. But in the short term, it explains why rewards might fluctuate day to day.
5. Payout Section (Your Rewards)
This is where you see your hard work pay off — literally.
Most pools display:
- Your pending balance (unpaid earnings)
- Your payout history (past transfers)
- Your threshold (minimum balance before payment)
Understanding payout methods helps too:
- PPS (Pay Per Share): You’re paid for each share, regardless of whether the pool finds a block.
- FPPS (Full Pay Per Share): Same as PPS but includes transaction fees.
- PPLNS (Pay Per Last N Shares): Rewards depend on your contribution to recent blocks — more variable, but can yield higher payouts.
Each model has its pros and cons, but FPPS is the most predictable for small to mid-sized miners.
6. Pool Fee and Earnings Summary
All pools charge a small fee (typically 1–2%) to manage operations.
Your dashboard’s summary section shows your net earnings after fees.
I like to check this weekly and compare it to my power costs to calculate profitability trends. Over time, those small percentage changes can help you optimize your strategy — or even decide if it’s time to switch pools.
7. Charts and Graphs
Visual dashboards are your friend. They help you spot trends:
- Temperature spikes = airflow or environment issue.
- Hashrate dips = possible network or hardware hiccup.
- Share delays = latency or connection issues.
If you can read the charts, you can predict and prevent downtime before it happens.
Satoshi Says: “The forest tells you when a storm’s coming — if you’re listening.” 🌳⚡
Putting It All Together: A Real-World Example
When I first added my four Avalon Qs to the mix, my pool dashboard looked great — at first. Reported hashrate was high, but effective hashrate lagged behind. If you haven’t read that full story yet, check out Adding Four Avalon Qs: What Changed?
After digging into the “Worker” and “Shares” sections, I realized my network latency was the culprit. Once I applied traffic shaping (prioritizing VoIP and balancing miner bandwidth), my effective rate jumped right back up.
The dashboard didn’t just show a problem — it taught me how to fix it.
That’s the real power of learning to read it: it turns your mining operation from guesswork into strategy.
Conclusion
Your mining pool dashboard is more than a display — it’s a living snapshot of your operation’s health.
Once you know how to interpret the numbers, you’ll understand what your miners are “saying,” and you’ll be able to act fast when something goes wrong.
As Satoshi Squirrel reminds us:
“A miner who understands his dashboard is never in the dark.” 🐿️💡
So take time to study it, explore each section, and don’t be afraid to make adjustments. Before long, you’ll go from reading your dashboard to mastering it — one block, one share, and one acorn at a time. If you’d like to see how this fits into my daily workflow, take a look at A Day in the Life of My Mining Setup.”
→ “And if you’re already planning ahead, start preparing early for the next big milestone — Preparing Your Nest for the 2028 Halving
Author
Tags: bitcoin

Recent Comments